What is an Inventory Analysis Report?
Information on how to run an Inventory Analysis Report and breaking down what information is included in it.
Table of Contents
- Overview
- How to run an Inventory Analysis Report
- Breaking down the Inventory Analysis Report
- Other Inventory Analysis Reports
Overview
Galley's Inventory Analysis Reports calculate the usage of vendor items over a period of time. This usage is determined by taking the ending cycle count value for an item and subtracting the starting cycle count value and the value that was received [usage = ending cycle count - (starting cycle count + receiving)].
How to run an Inventory Analysis Report
The various inventory analysis reports are available in Galley's Reports catalog in the Inventory folder. (See How do I run reports in Galley?)
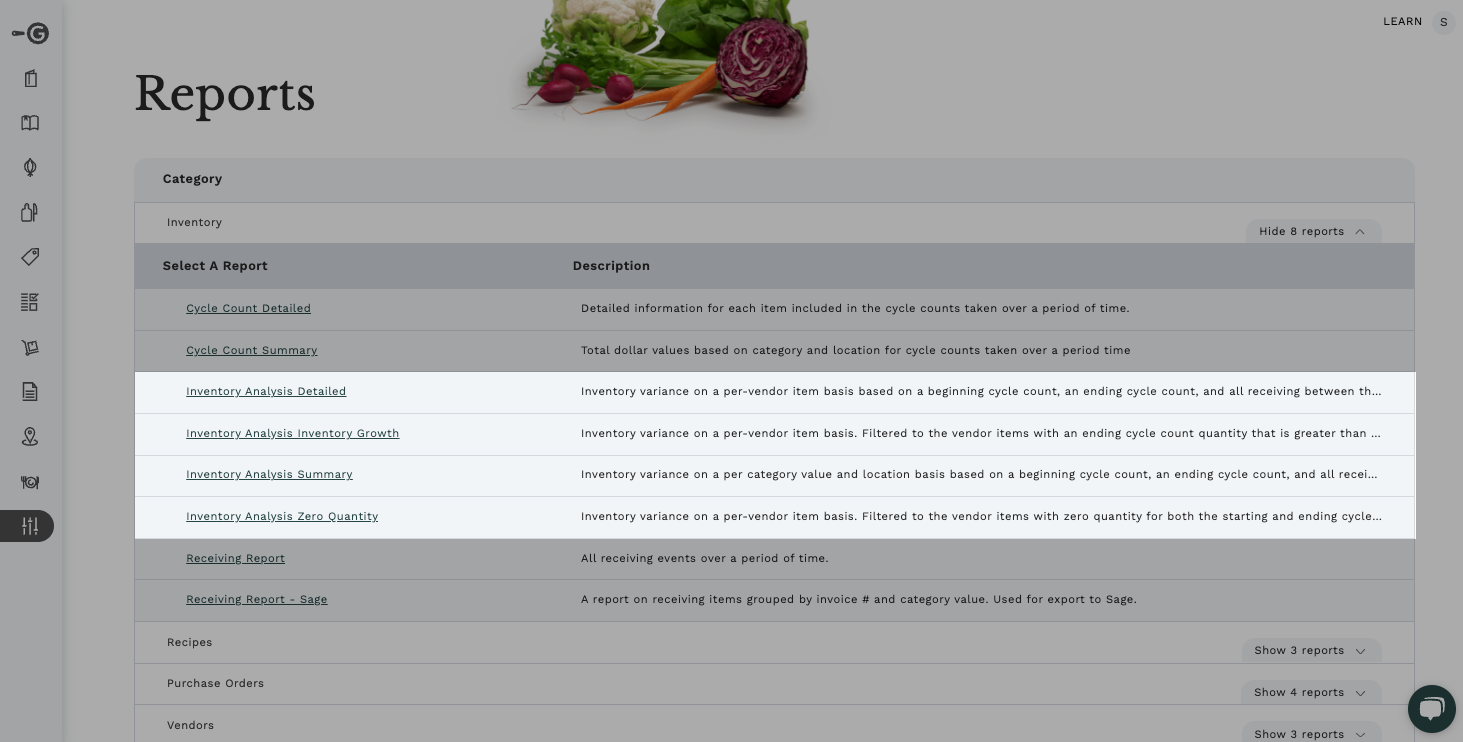
The Inventory Analysis Reports have four parameters:
- Start Date: Earliest date for a starting cycle count for each item
- End Date: Latest date for an ending cycle count for each item
- Location: Filter the inventory events in the report to those from a certain location or set of locations. When selecting a specific location, be sure to de-select the All Locations option.
- Subtotals by: Select the field that the items in the report should be grouped by and the subtotals should be calculated for. This could be using an ingredient category, a vendor item category, or the vendor item GL Code field.

Breaking down the Inventory Analysis Report
The Inventory Analysis Report calculates the usage of inventoried vendor items. Therefore, each row of the report represents a vendor item that was cycle counted at least once between the Start Date and End Date. The vendor items are grouped by category value and then by location, with summary rows at the bottom of each group.
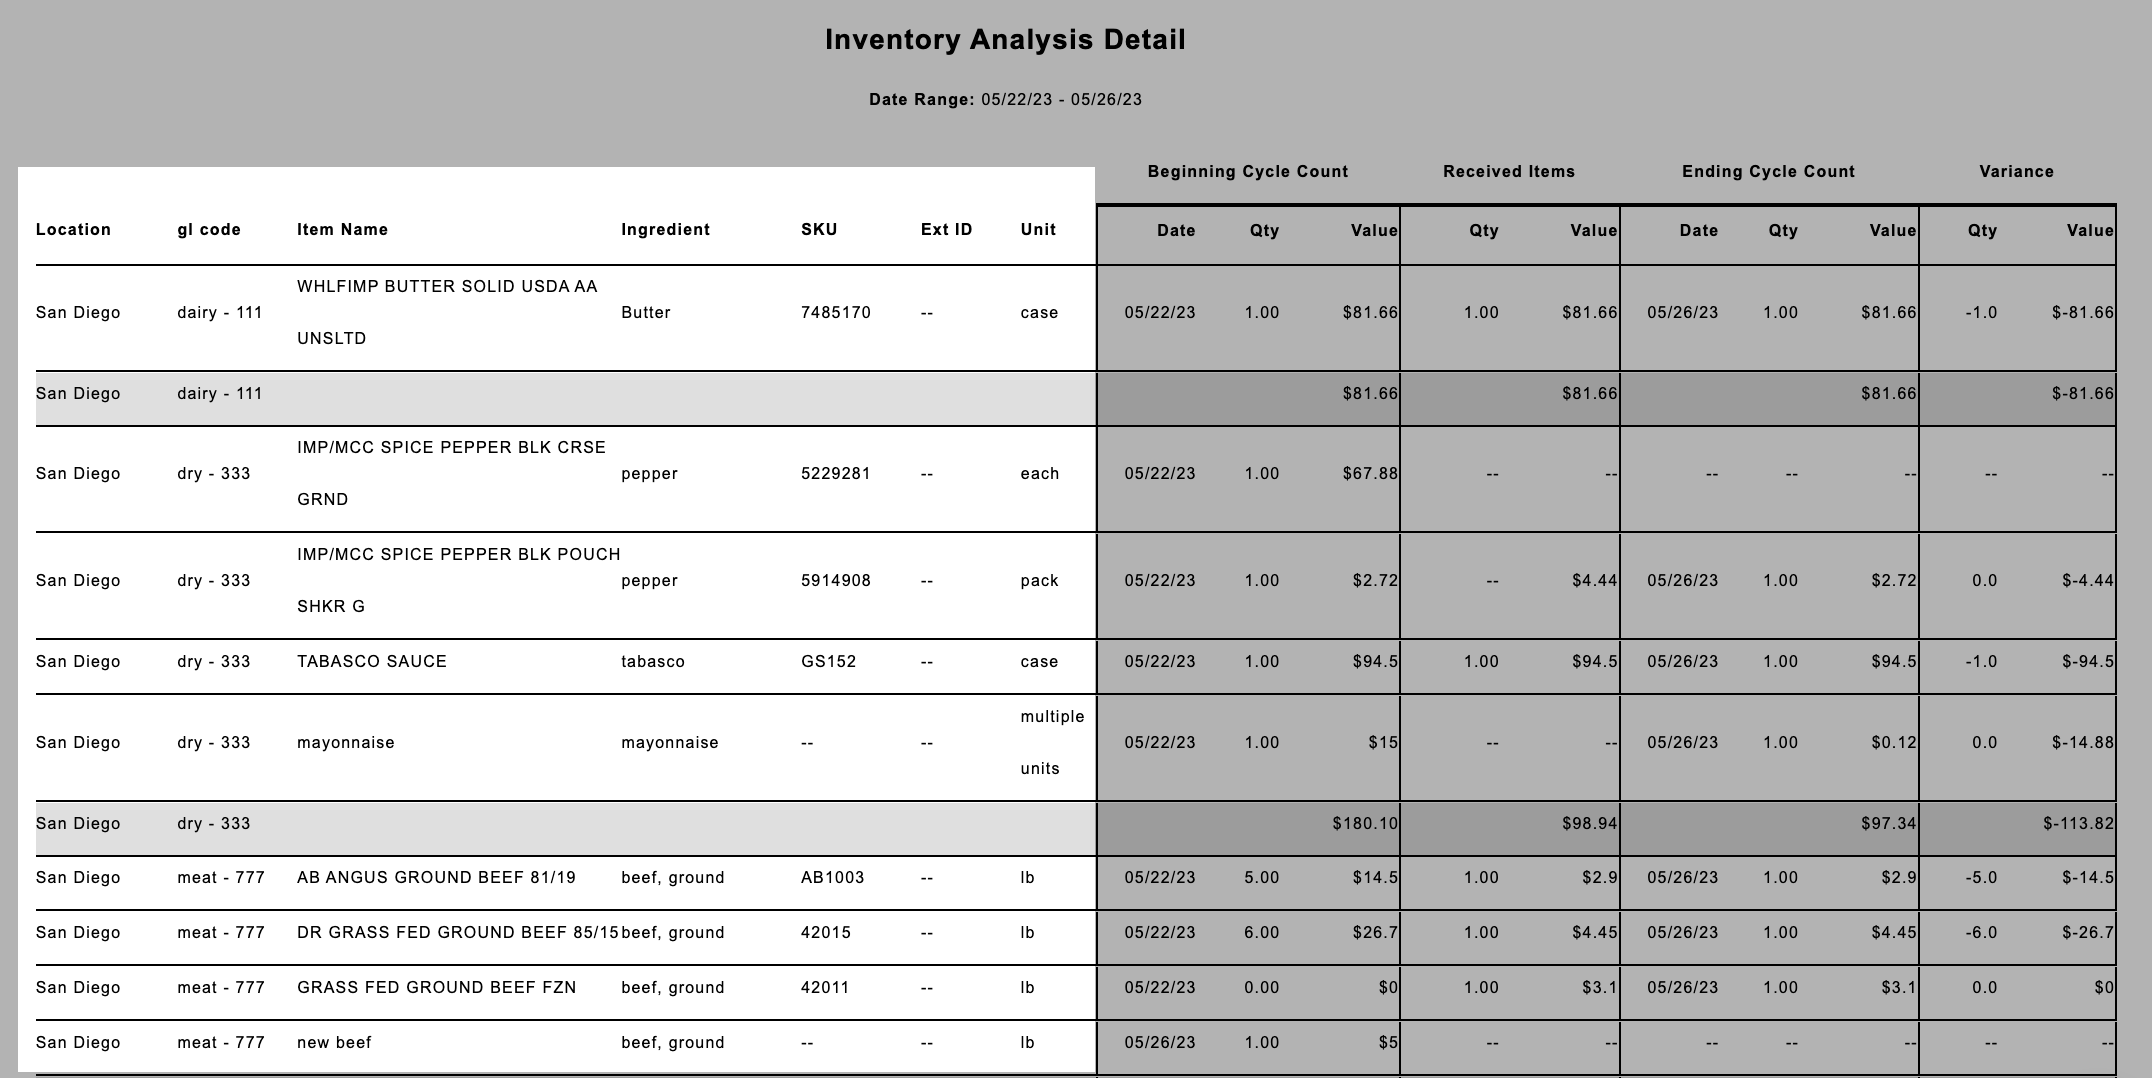
Based on the start date that was set as a parameter, Galley will pull the earliest cycle count for each vendor item at a given location. If an item was included in two cycle counts with the same date, the value from the cycle count that was submitted second will be included instead of the first (adhering to the cycle count correction workflow).
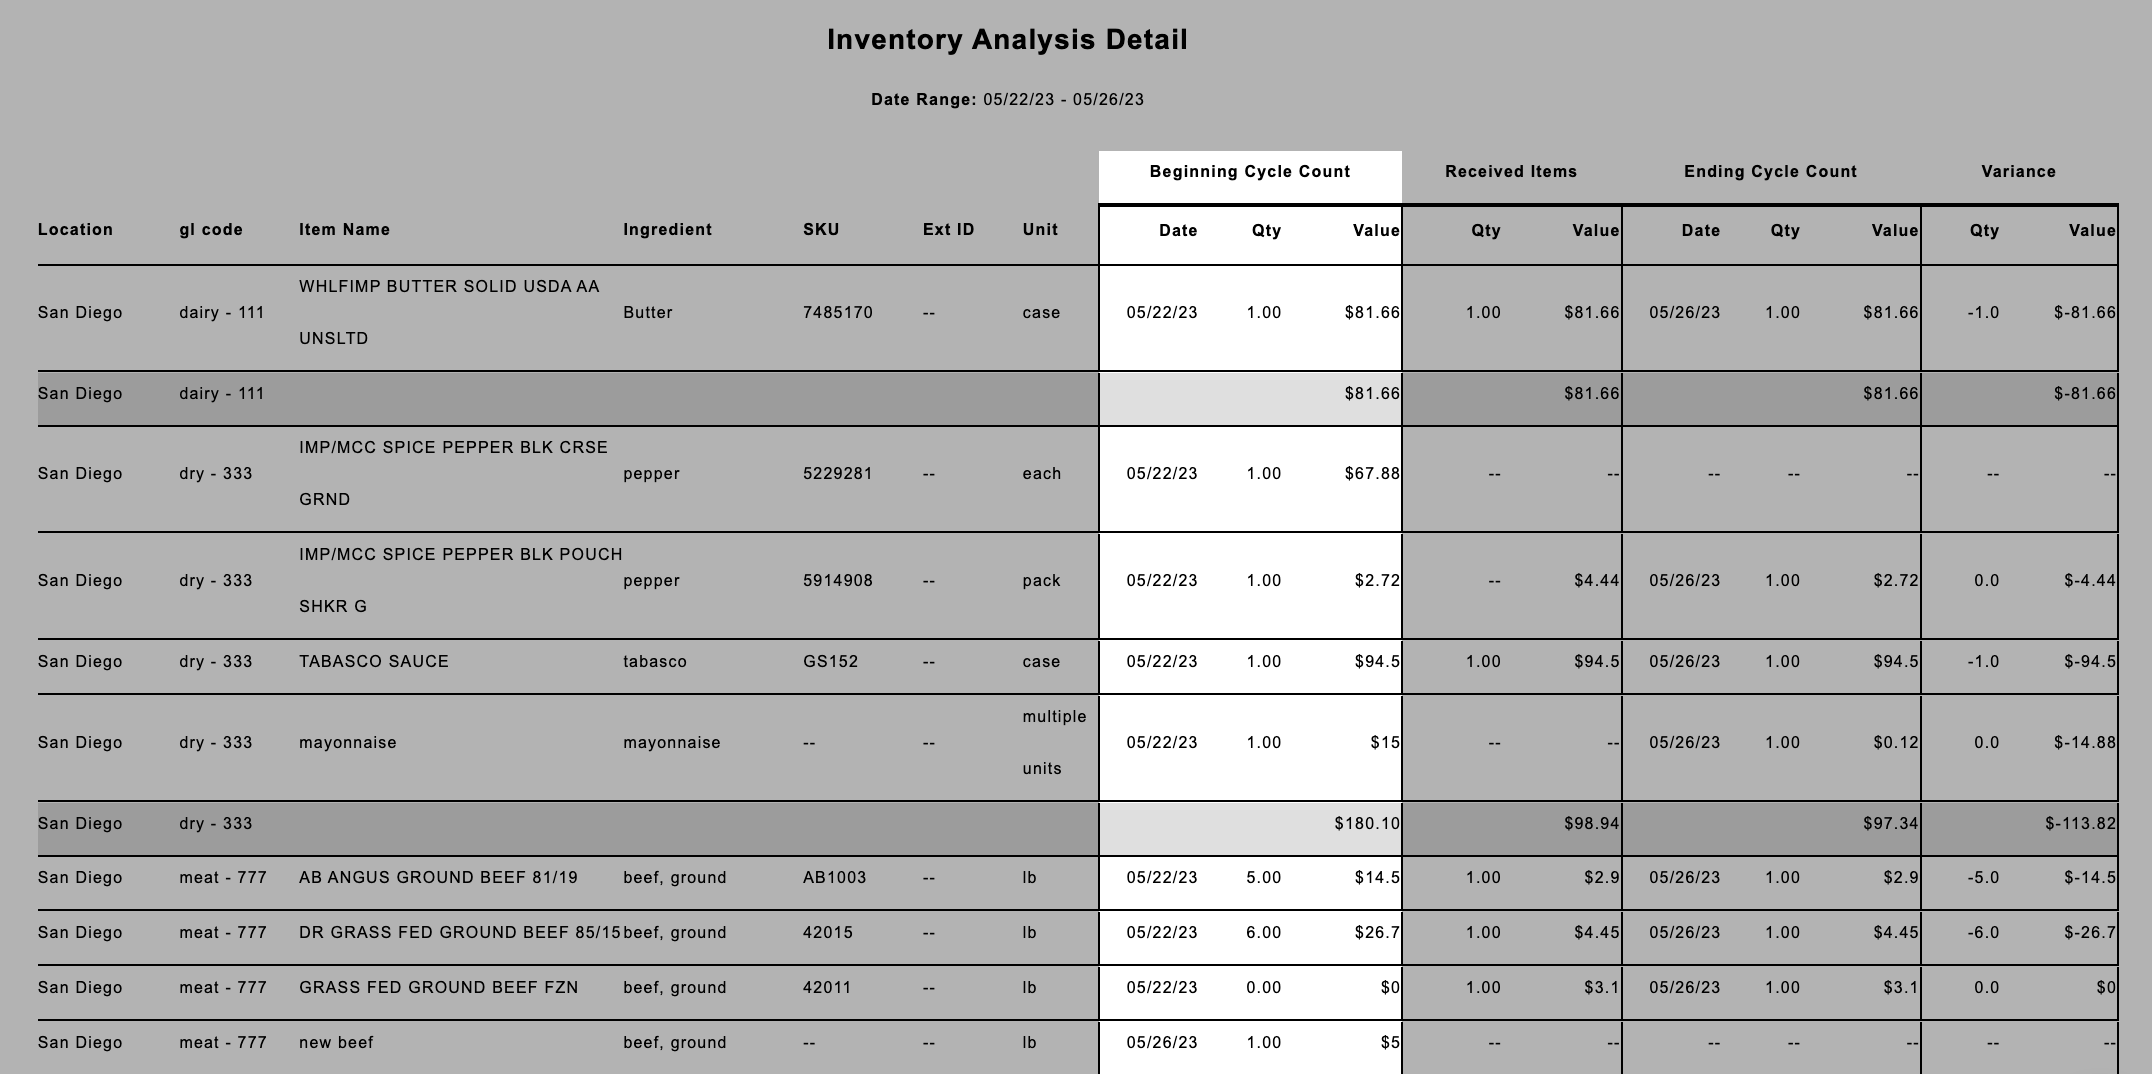
Then, Galley will search for the latest cycle count for each vendor item at a location during the time period. If a given item was only cycle counted once during the date range, that count will appear as the starting count and there will be no ending count.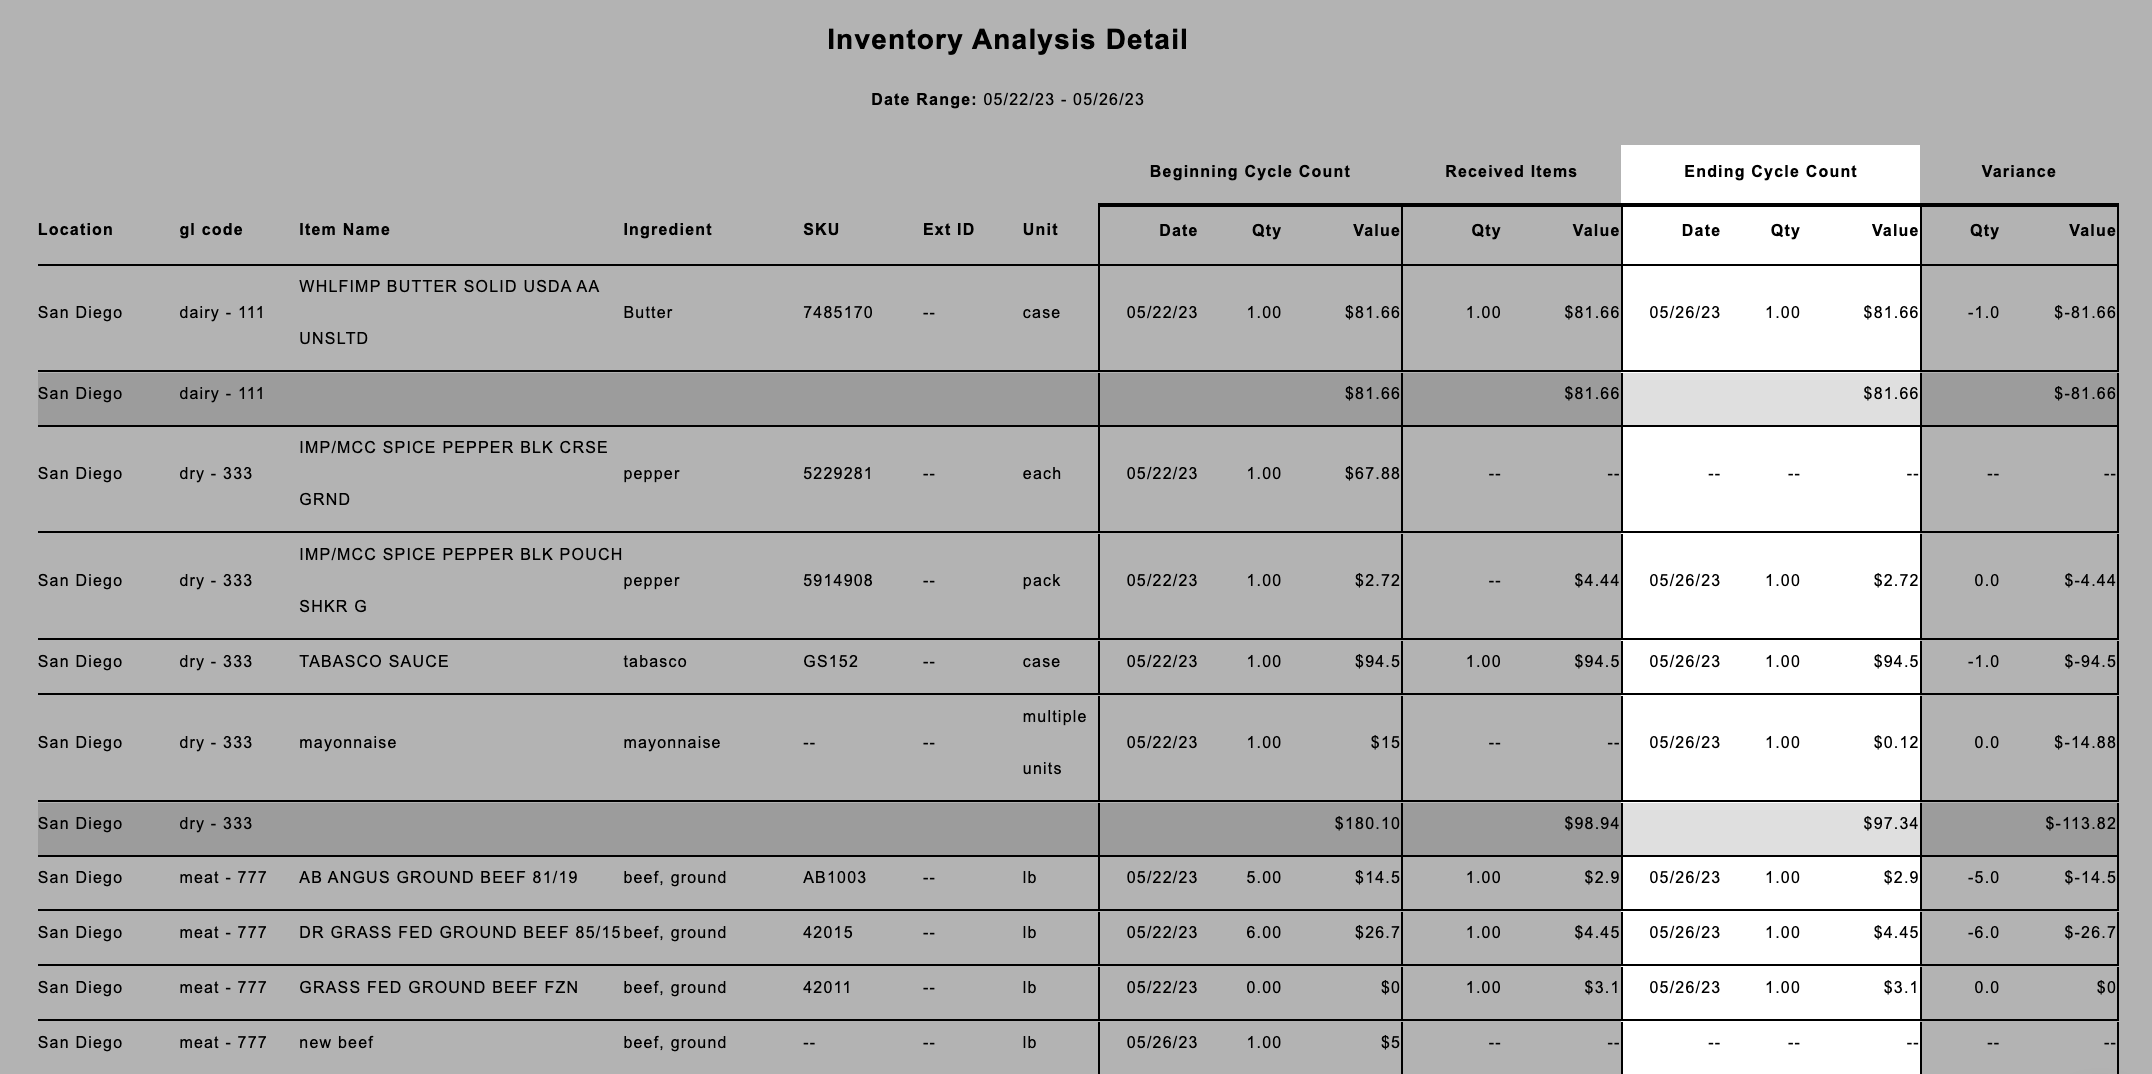
Next, the receiving events that are dated between the starting and ending cycle count for each item at a location are aggregated. Therefore, if there is not a starting and ending cycle count for a given item, no receiving events will appear.
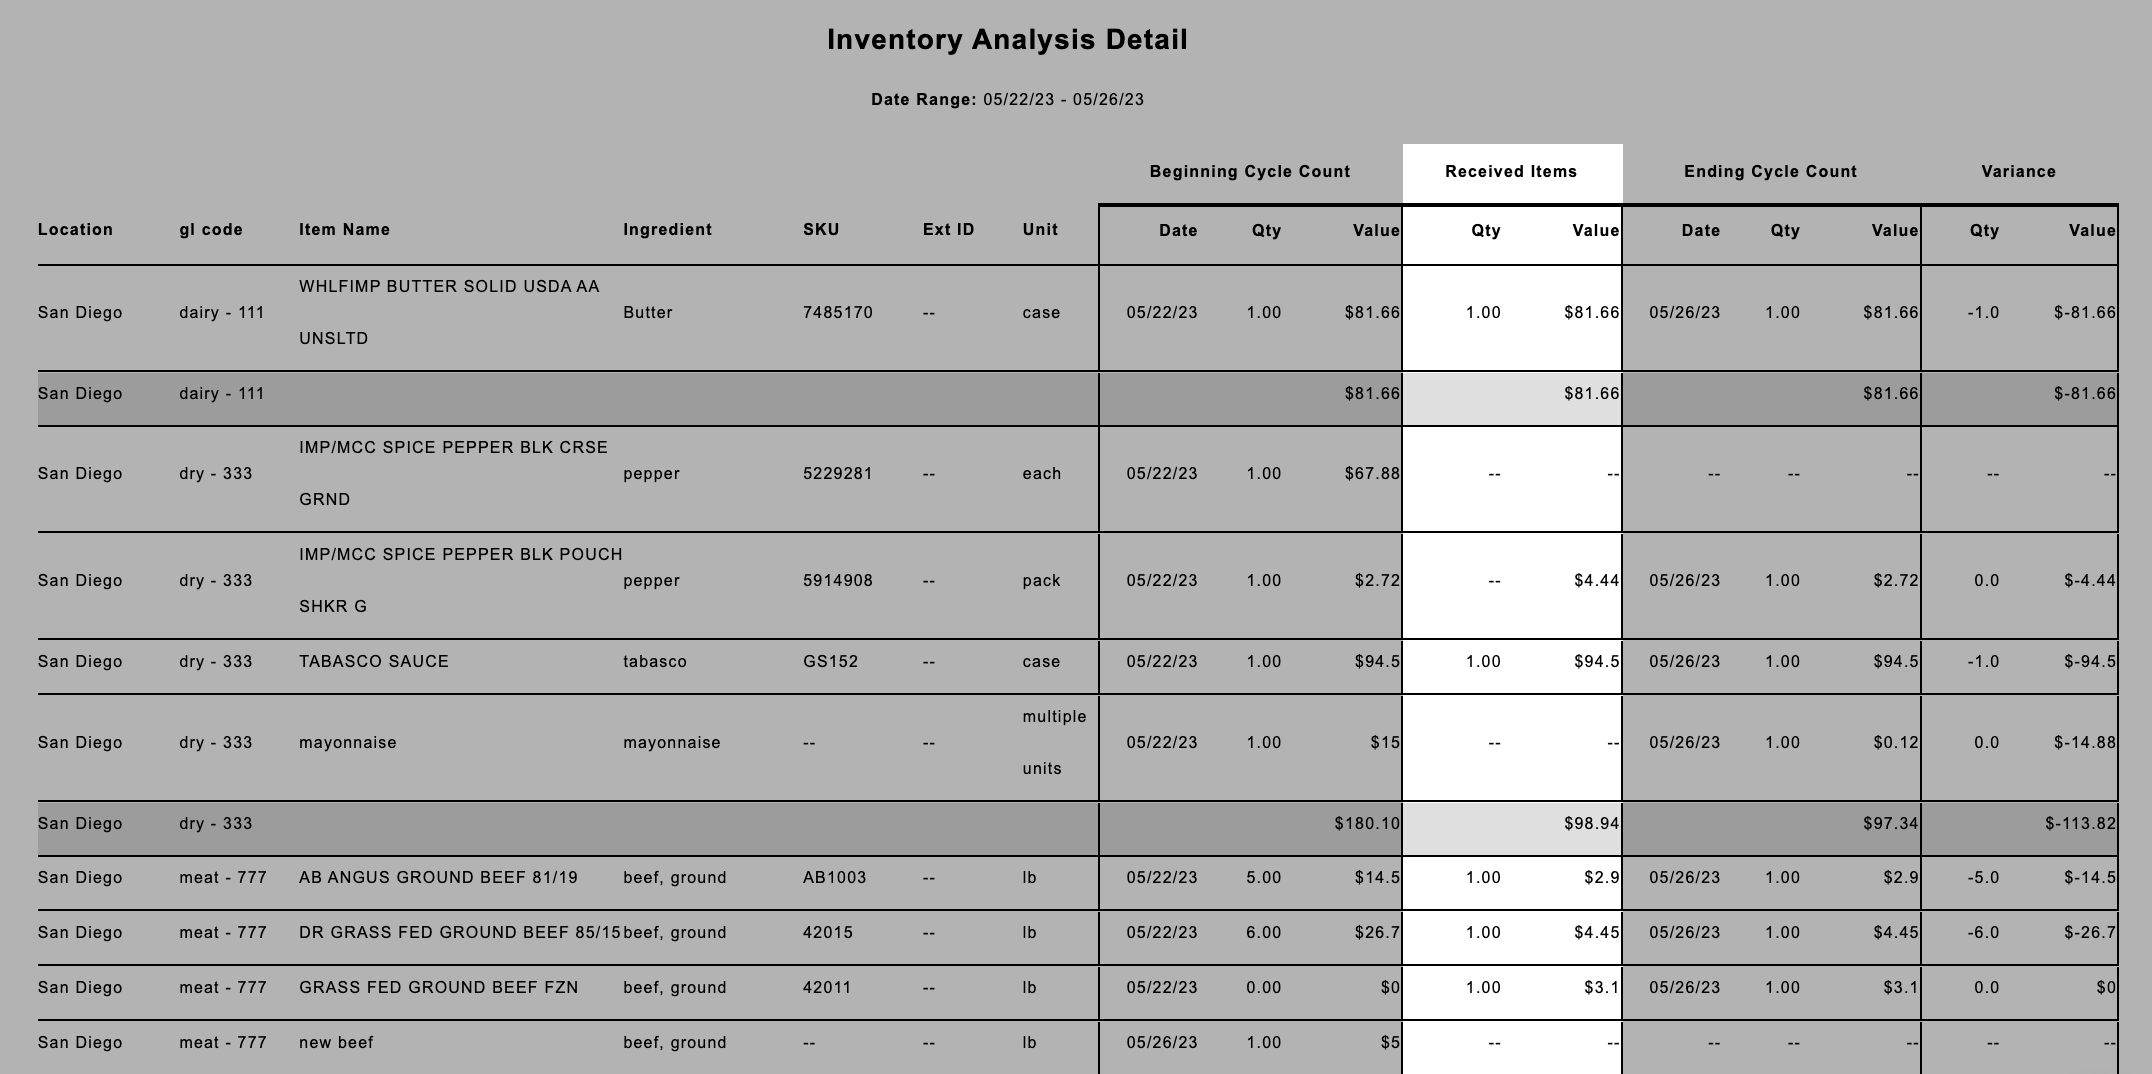 Finally, a variance is calculated by taking the ending cycle count and subtracting the starting cycle count and received items.
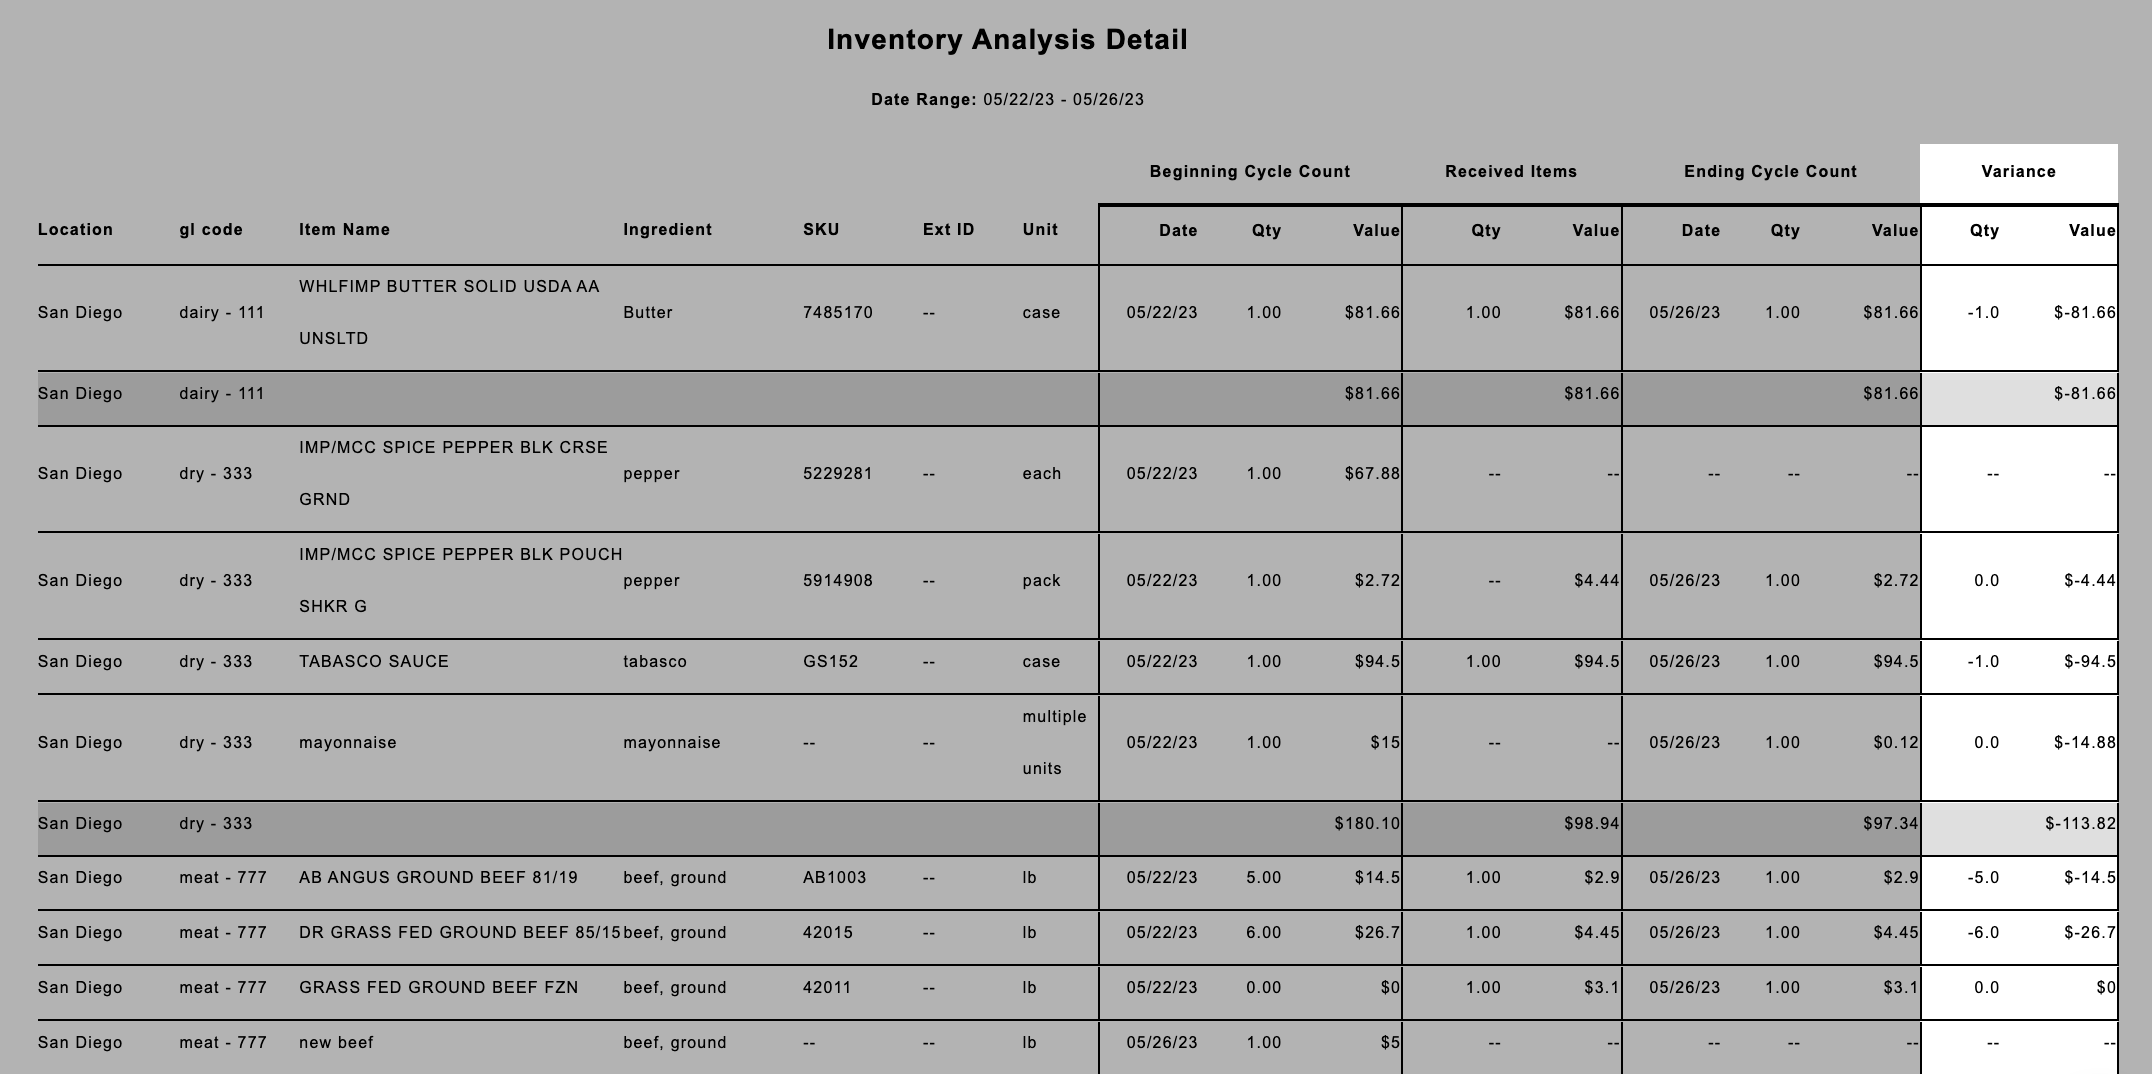
For each type of event there is a quantity, unit cost, and total cost. If a given vendor item had events with multiple different units the total cost will be displayed for the item but not the unit costs or quantities.
Other Inventory Analysis Reports
Inventory Analysis Summary
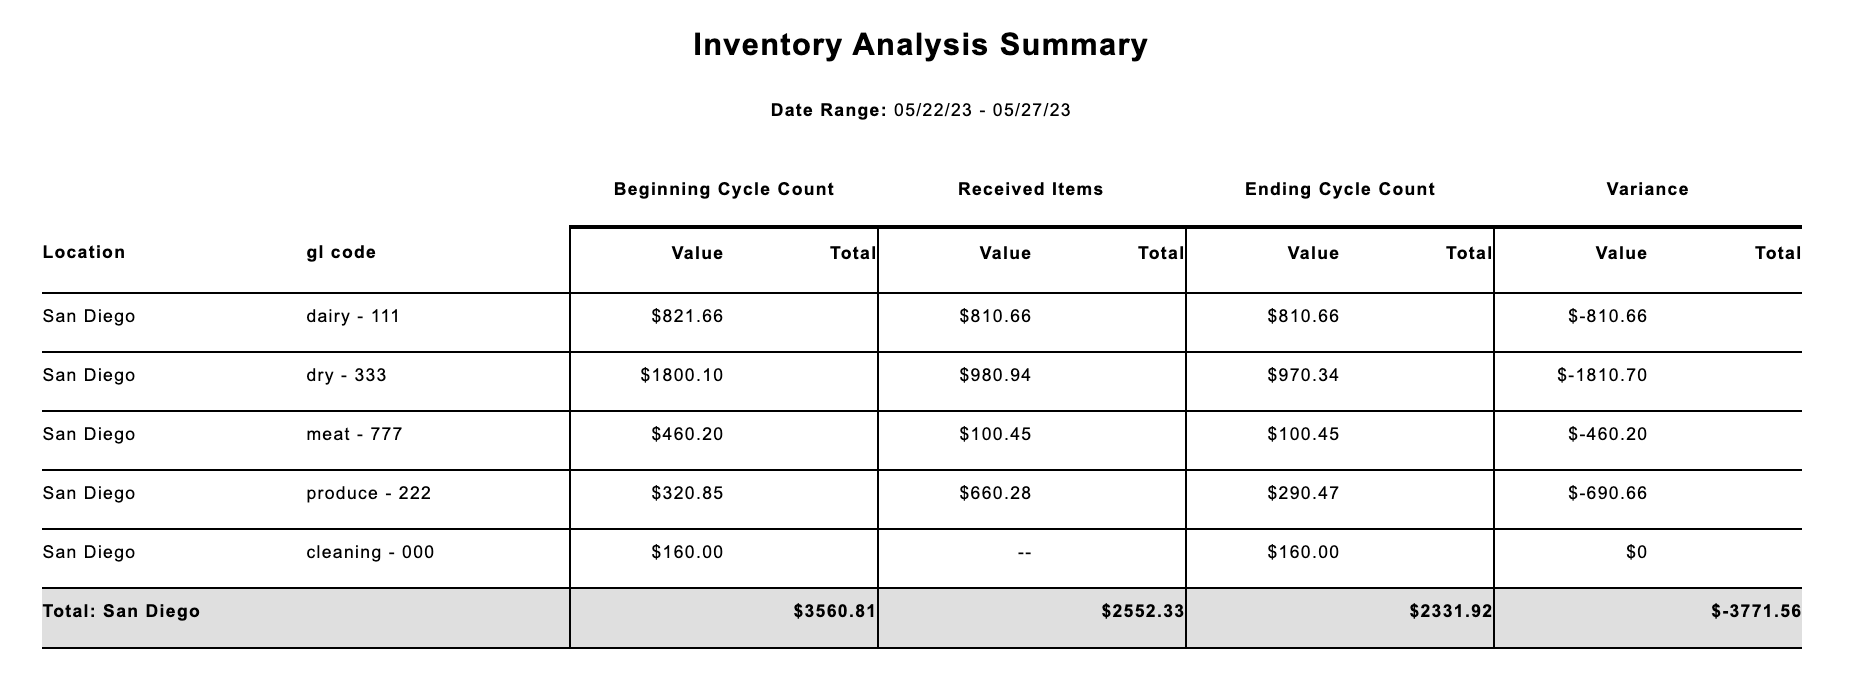
The Inventory Analysis Summary report provides aggregated cycle count, receiving, and variance values for each category value and location. Unlike the detailed reports, the Inventory Analysis Summary report does not show vendor item-level detail.
Inventory Analysis Detailed - Growth
The Inventory Analysis Growth report only includes the items that have an ending cycle count value that is higher than their starting cycle count value. The report is sorted based on the growth percentage.
Inventory Analysis Detailed - Zero
The Inventory Analysis Zero report only includes the items that were counted as out-of-stock in both the starting cycle count and ending cycle count, and had no receiving events over the period of time.
