How do I calculate Actual vs Theoretical food cost?
Boost profitability by reducing variance between Actual and Theoretical Cost of Goods Sold (COGS)
What is Actual vs Theoretical?
Conducting an Actual vs Theoretical food cost analysis compares what your food spend should have been during a period of time with what your food spend actually was.
The variance between the actual and theoretical food spend gives insight into the efficiency of your business and reducing the variance will increase profitability. Some reasons for a high variance could be:
- Waste
- Over-portioning
- Theft
The first step to reducing the variance is knowing the variance, that's where the Actual vs Theoretical report (AvT) comes in. The AvT report calculates food cost variance by comparing Actual Cost of Goods Sold (COGS) to Theoretical COGS.
Actual COGS
Actual COGS represents how much of each vendor item was used over a period of time. The AvT report calculates Actual COGS via the starting and ending cycle counts in a period of time and the inventory received in that same period. The formula is as follows:
Actual COGS = (Starting Cycle Count + Receiving) - Ending Cycle Count
Theoretical COGS
Theoretical COGS, on the other hand, represents how much of each vendor item should have been used based on what was sold. Theoretical COGS is calculated based on the Volume Sold field on Menu items.
Variance
The Variance (Actual minus Theoretical) and Variance % (Variance / Actual COGS) inform how efficiently each vendor item is managed. The variance can then be rolled up to food type and location to understand, for example, how efficient a location is at managing produce or how efficient a location is in general. The lower the variance, the more efficient the operation.
What are the requirements for an accurate AvT Report?
To generate an accurate AvT report you will need to use Galley's inventory system to its fullest. The following requirements must be met for the AvT report to work as expected:
- Comprehensive cycle counts on the AvT starting & ending dates
- No backdated cycle counts.
- Receiving Inventory
- Sales data on Menus.
- Vendor items tagged with a category value or with a GL Code entered.
How do I run an AvT Report?
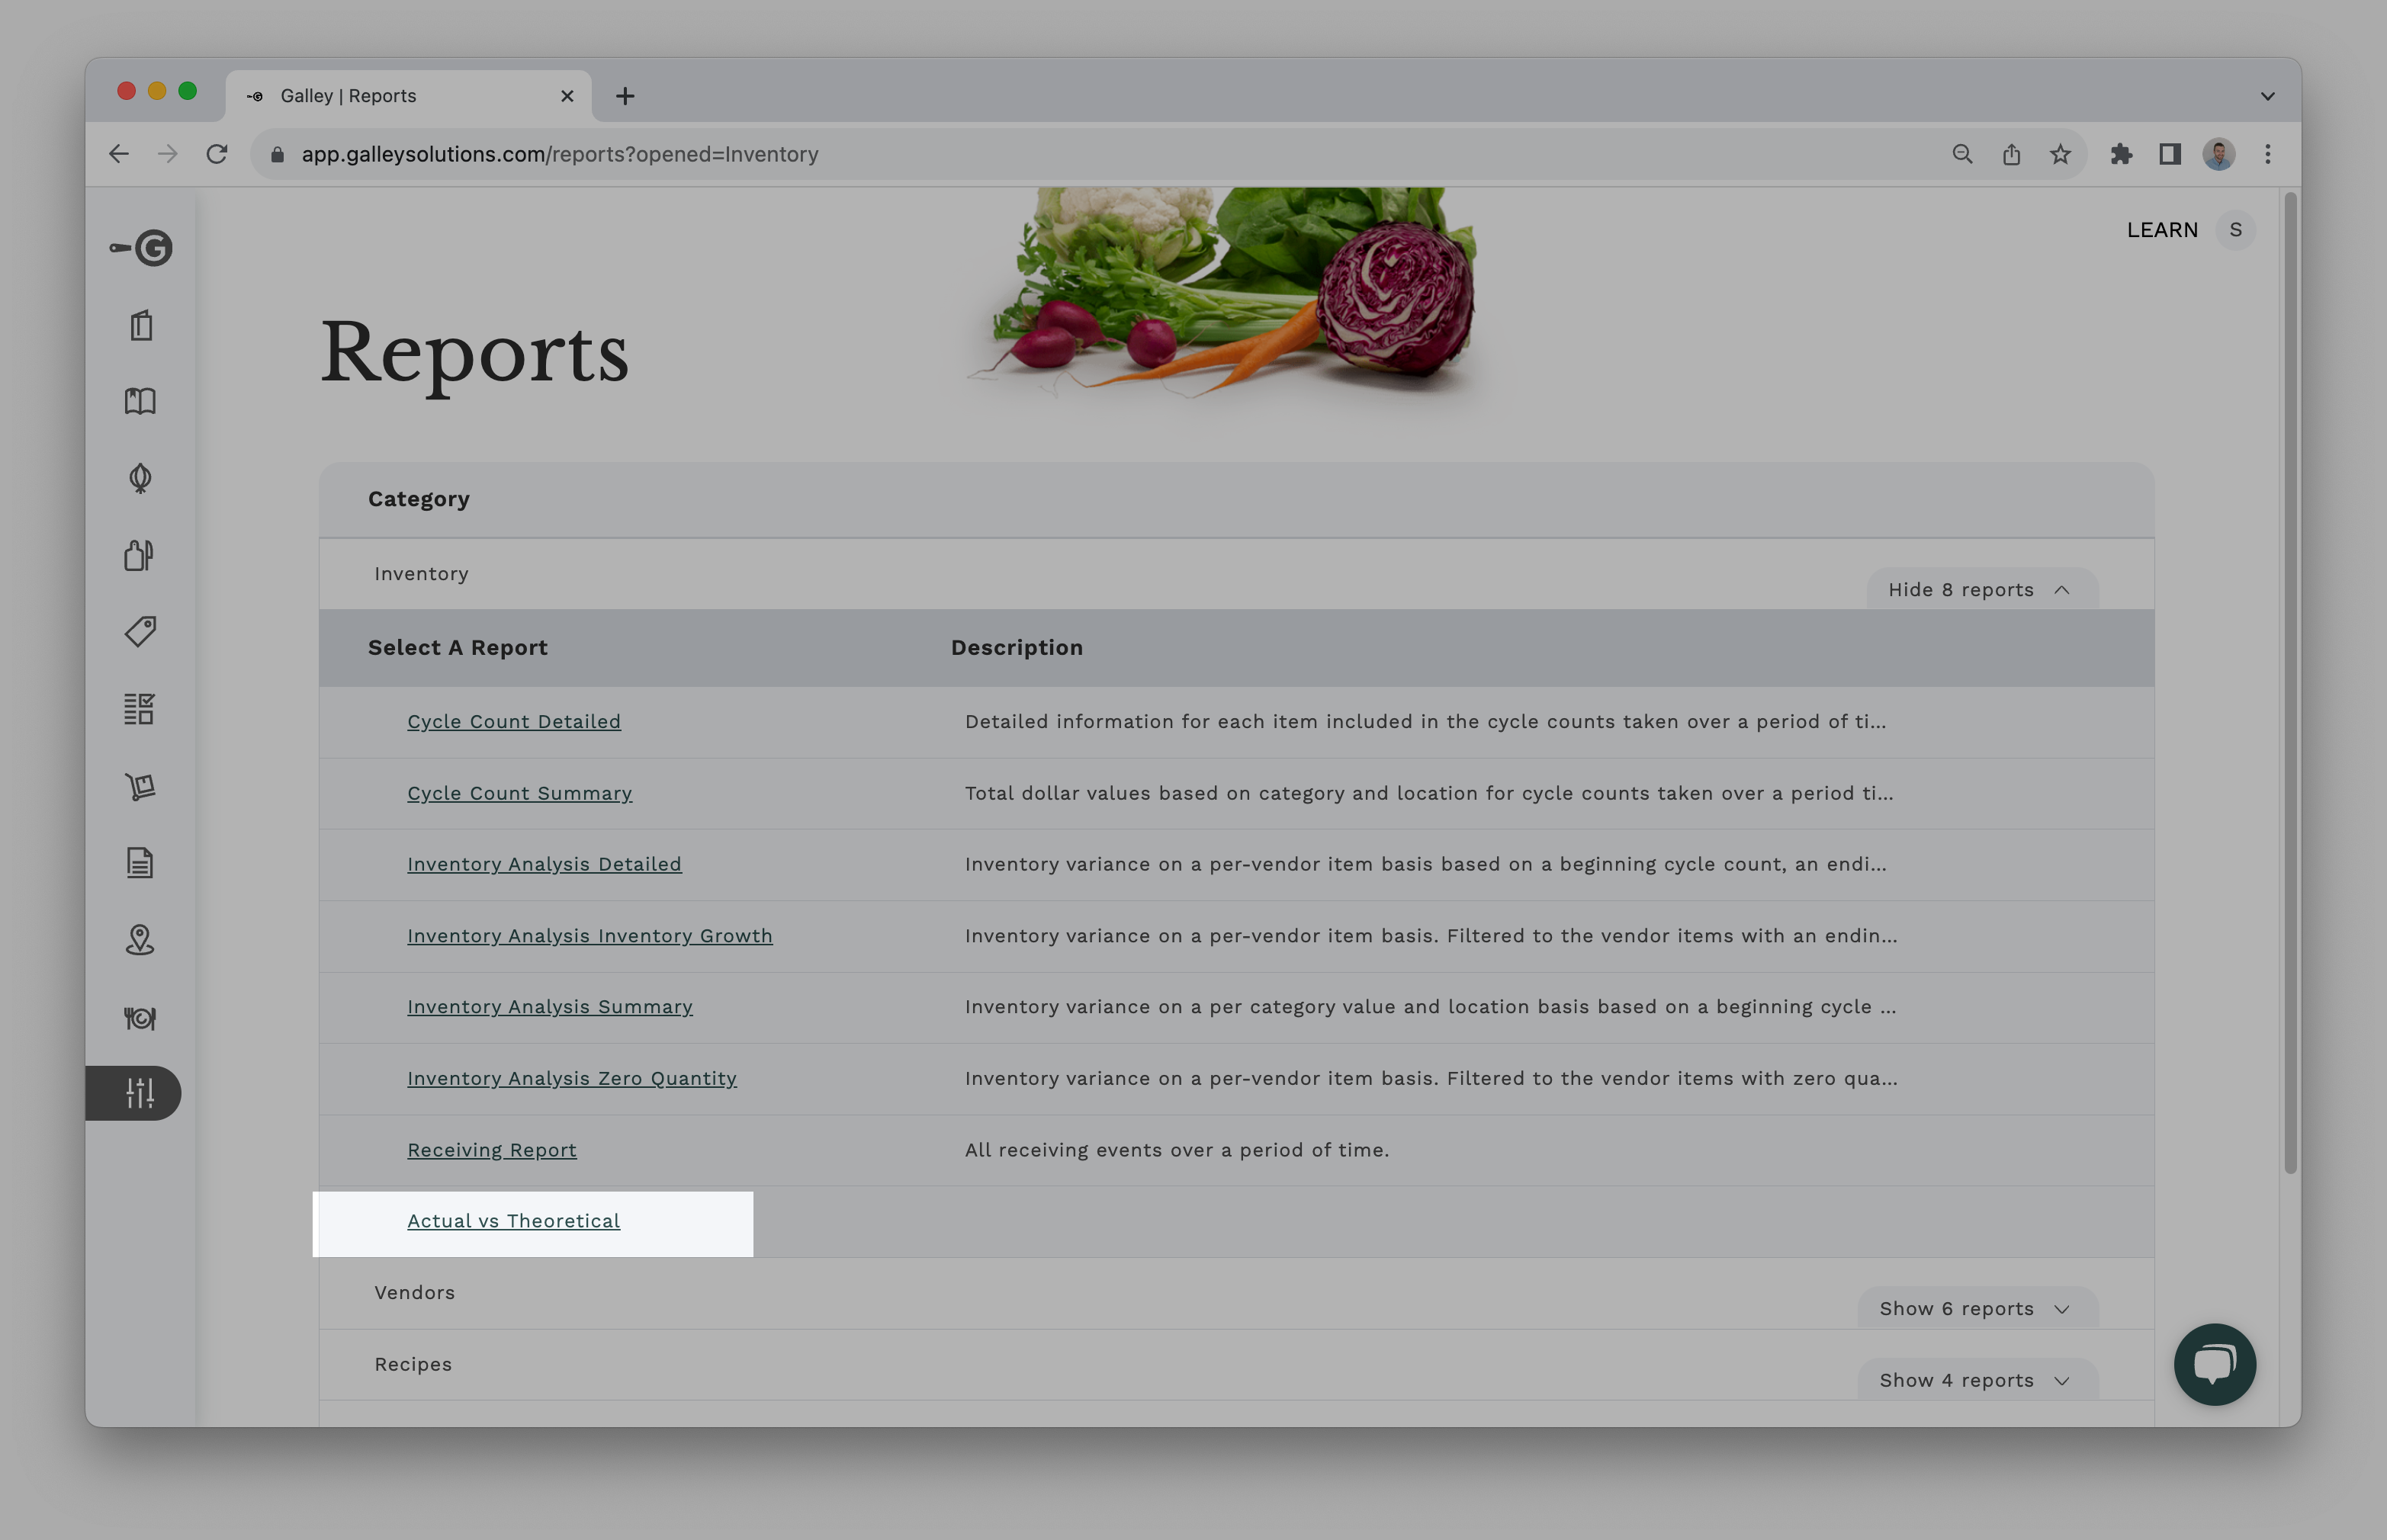
The Actual vs Theoretical (AvT) report is in the Inventory folder of the Reports catalog. Simply click the Actual vs Theoretical report to begin.
If you do not have access to the Reports catalog or the AvT report please contact your Galley Customer Success Manager.

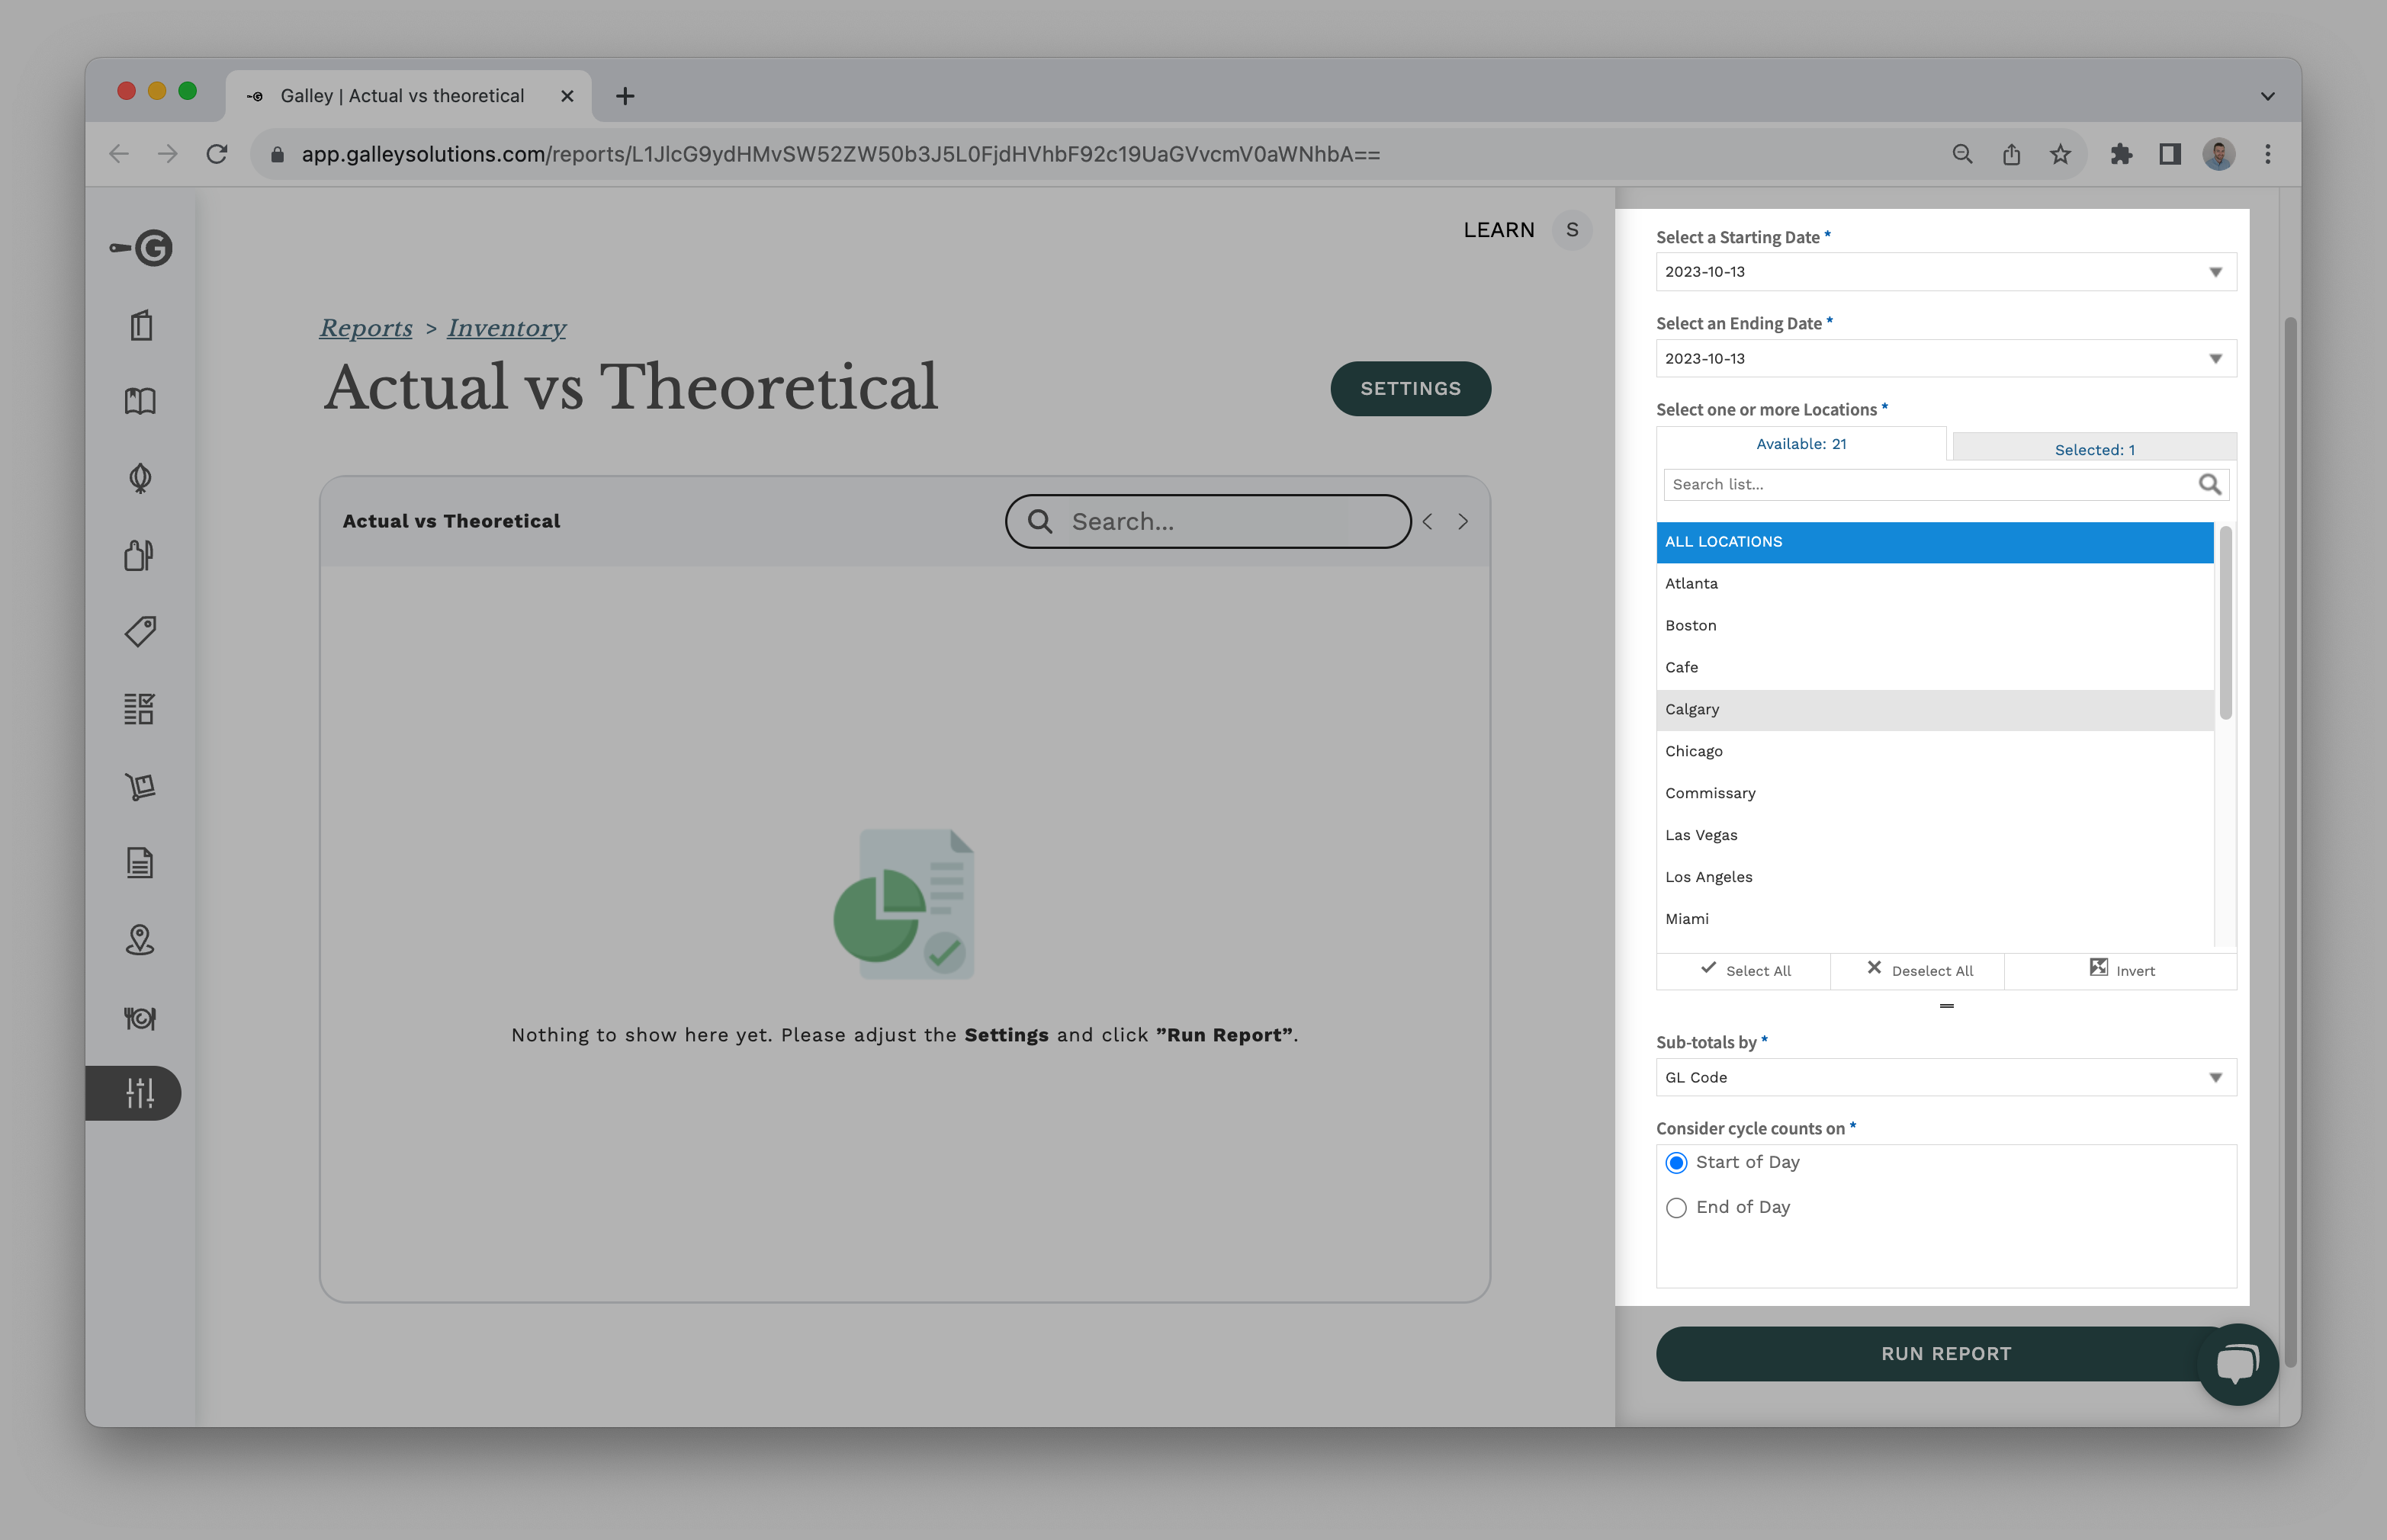
You will be prompted to fill in the report settings. The settings define what data Galley will pull into the report. See the definitions of these settings below:

- Starting Date: The date of the first cycle count you would like to pull into the report.
- Ending Date: The date of the final cycle count you would like to pull into the report.
- Locations: The distinct location(s) you would like to report on. When the report is executed, the data for each location will be grouped and totaled separately. If running the report for a single location, be sure to un-select All Locations.
- Sub-totals: The report will use this to calculate sub-totals. This can either be based on the vendor item field GL Code or any vendor item tag.
- Consider cycle counts on: This setting determines if the inventory levels set in the cycle counts should be considered as the inventory at the start of the day or at the end of the day. If Start of Day is selected, the receiving and sales that took place on the starting date will be included in the report but those on the ending day will not be included. The opposite is true is End of Day is selected.
When ready, click Run Report.
