What Are Menu Plan KPIs?
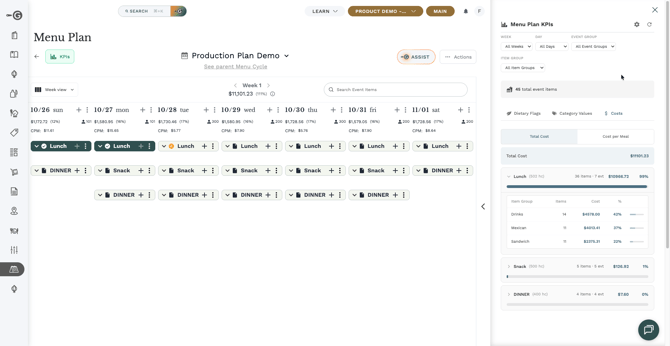
Menu Plan KPIs is a built-in analytics panel that gives you real-time visibility into your menu plan's performance — right alongside the plan itself. Without switching to a separate report or spreadsheet, you can see how costs are tracking, how dietary variety is distributed, and how your ingredient categories break down across every event.
The KPI panel appears on the right side of any open menu plan. It organizes data into three tabs — Costs, Dietary Flags, and Category Values — and lets you filter and drill down by week, day, event group, and item group.
How to Open the KPI Panel
To open the KPI panel:
- Navigate to Menu Planner and open any menu plan.
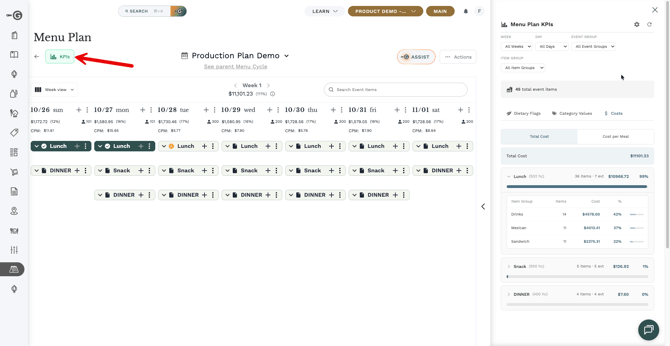
- Look for the KPIs button in the top-left corner of the plan header, next to the back arrow.
- Click KPIs. The panel slides open on the right side of the screen.
- To close it, click the KPIs button again.
The KPI panel and the History panel share the same space. Opening one will close the other.
Navigating the Metric Tabs
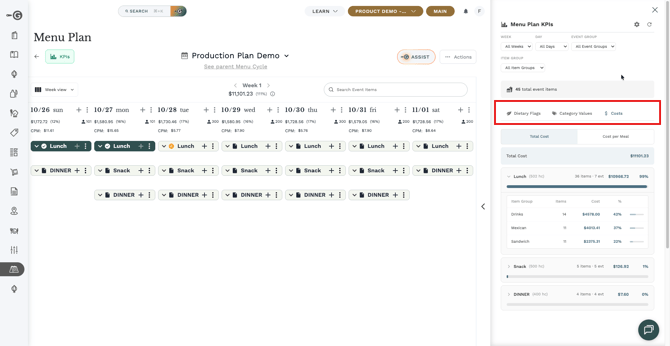
At the top of the KPI panel, you'll find three tabs. Each gives you a different view of the same plan.
Dietary Flags
The Dietary Flags tab shows how dietary attributes (such as vegetarian, vegan, or gluten-free) are distributed across your plan. You'll see item counts and percentages for each flag, broken down by event group and item group.
This is especially useful for institutional foodservice or operations that need to ensure dietary variety across a planning period.
Category Values
The Category Values tab shows how your ingredient and product categories are represented across the plan. Each category appears as a tab of its own, with counts and percentage shares at every level.
You can configure which categories appear by default — see the Configuring Default Categories section below.
Costs
The Costs tab shows the total financial footprint of your menu plan. It has two sub-views you can switch between:
- Total Cost: The cumulative cost of all items in the plan, broken down by event group and item group.
- Cost Per Meal (CPM): The cost normalized by headcount for each event, so you can see what each meal actually costs per person.
Both views show percentage breakdowns alongside absolute values, so you can quickly spot which events or groups are driving cost.
Filtering Your View
The KPI panel includes four filter controls that let you narrow the data to a specific slice of your plan.
| Filter | What It Does |
|---|---|
| Week | Limit the view to a specific week within the plan (or show all weeks). |
| Day | Narrow to a specific calendar day. |
| Event Group | Focus on a single event group (e.g., Breakfast, Lunch, Dinner). |
| Item Group | Drill into a specific item group within an event. |
Filters work together — for example, you can select Week 1, then Tuesday, then Breakfast to see only Breakfast items from that day.
Expanding and Drilling Down
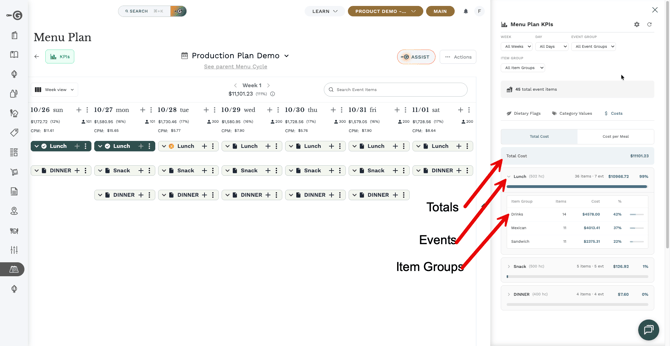
Each KPI metric row can be expanded to reveal detail at three levels:
- Metric level: The top-level summary (e.g., total cost, a dietary flag count, a category total).
- Event group level: Click the arrow next to any metric row to see a breakdown by event group (Breakfast, Lunch, Dinner, etc.).
- Item group level: Click into an event group row to see a further breakdown by item group, with individual counts and percentages.
Progress bars and percentage values appear at every level, making it easy to see at a glance what's driving the numbers.
Setting Your Default Category Tabs
The Category Values tab shows a set of ingredient and product categories. There are default categories, and "quick pick" categories to pick from. Your company will have its own defaults (configurable by an Admin), but you can customize which categories appear only for you.
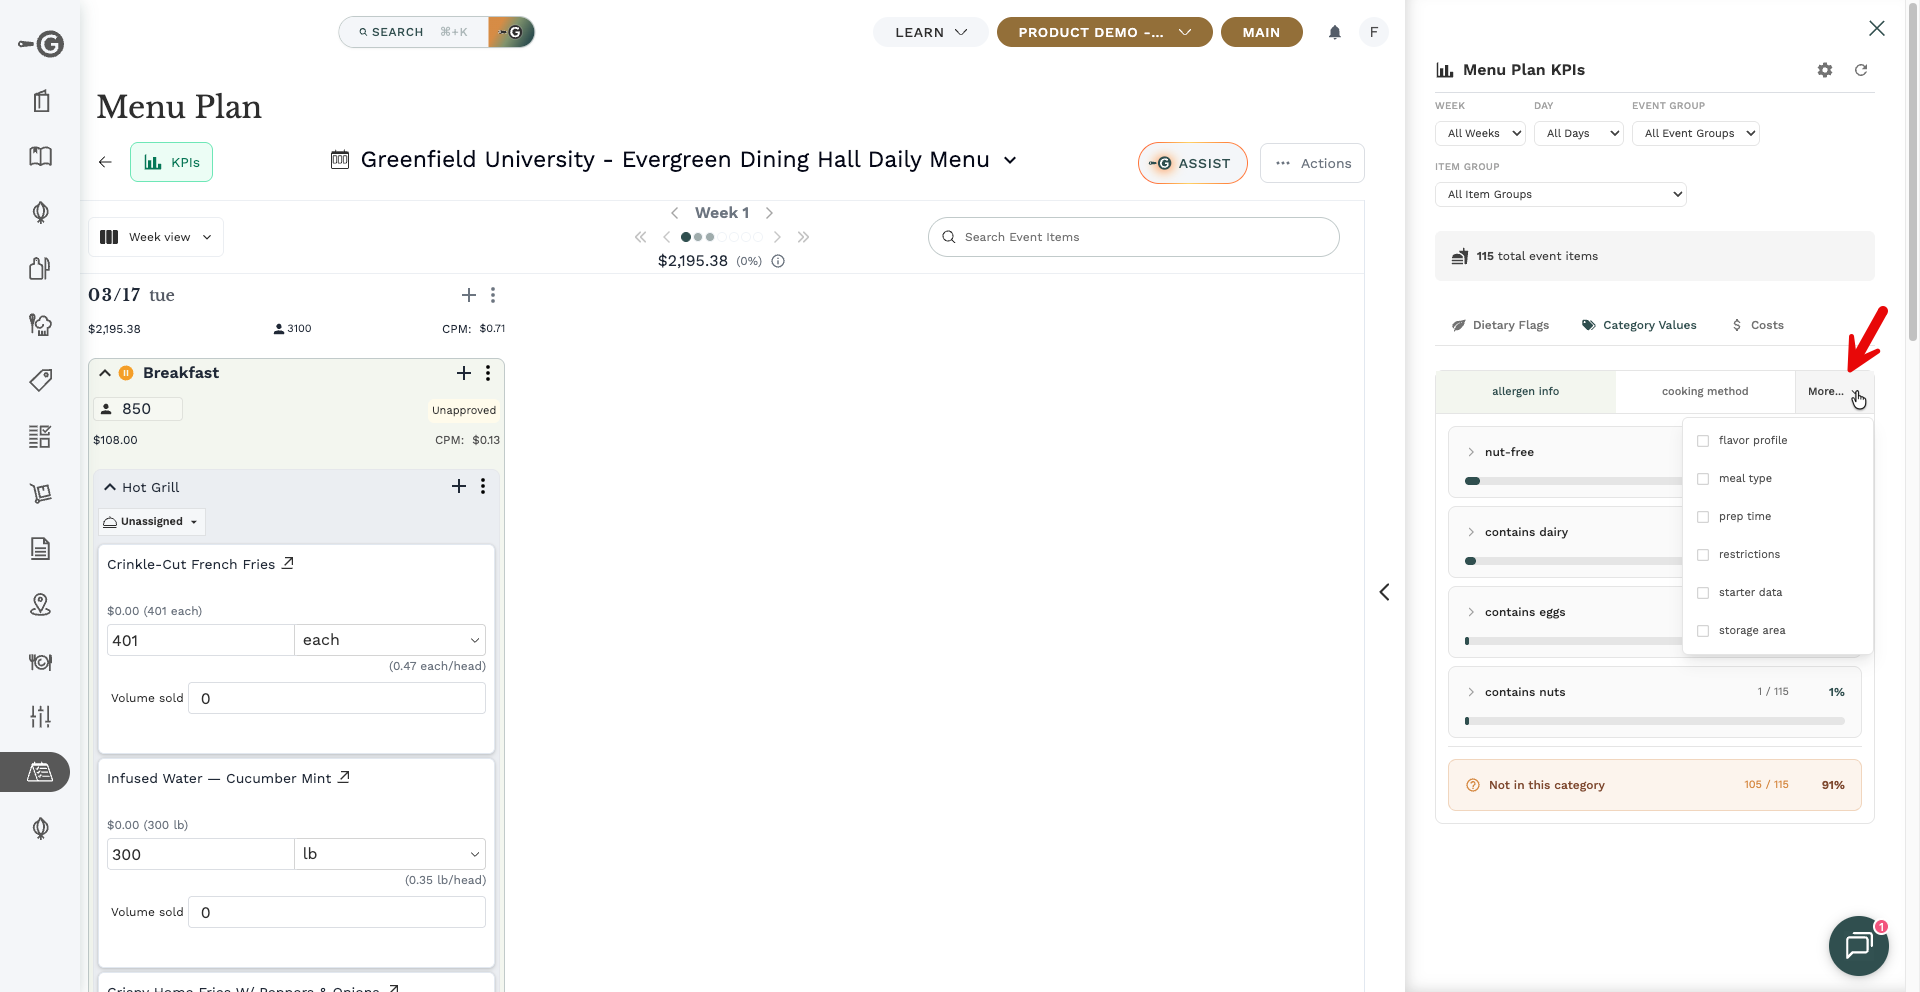
Quick picks (All Users)
You can select any category for a quick view of the breakdown:
- Open the KPI panel in any menu plan.
- Click "More".
- Select the Categories you want to see
Personal Defaults (All Users)
To set your own default categories:
- Open the KPI panel in any menu plan.
- Click the settings icon (⚙) in the top-right corner of the KPI panel header.
- In the dialog, select up to 3 categories you want to see by default.
- Click Save. Your preferences are saved to your account.
Personal defaults only apply to your view — they do not affect other users.
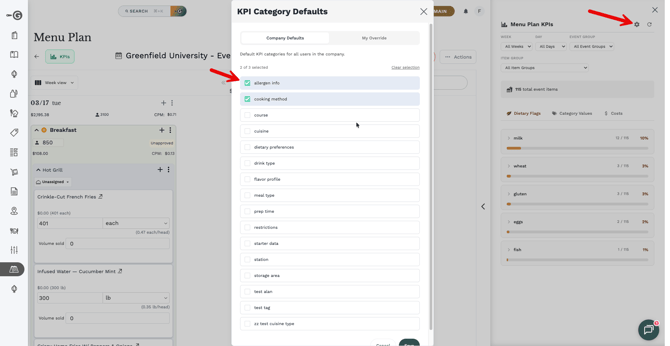
Company-Wide Defaults (Admins Only)
Admin users can set default categories for everyone in the organization:
- Open the KPI panel settings (⚙ icon).
- Switch to the Company tab in the settings dialog.
- Select up to 3 categories to use as the company-wide default.
- Click Save.
Personal preferences always override company defaults. If a user has set their own defaults, they will see those instead.
Not sure which categories to pin? Start with your most-tracked cost centers — protein, produce, and dairy are common choices for foodservice operations.
Troubleshooting and FAQ
The KPI panel shows no data.
This usually means the menu plan has no items added yet, or the active filters are too narrow. Try clearing all filters by resetting each one to "All." If the plan has items and data still doesn't appear, try refreshing the page.
My Category Values tab looks different from my colleague's.
Each user can set personal default categories, which override the company defaults. You and your colleague may have different personal preferences saved. To reset to the company defaults, open the settings (⚙) and clear your personal selections.
Can I export KPI data?
The KPI panel is a live view — it does not currently support direct export from the panel itself. For exportable cost and category reports, use the Reports module in Galley.
Why is my CPM showing $0.00?
Cost Per Meal is calculated using the headcount entered for each event. If an event has no headcount set, CPM will show as $0.00. Add headcount to your events in the menu plan to see accurate CPM figures. CPM calculation will also ignore headcount from events that don't have any item yet.